
Figure 6. H-89 shows dose dependent inhibition of proliferation induces cell death and causes G1/S phase arrest in cell cycle.
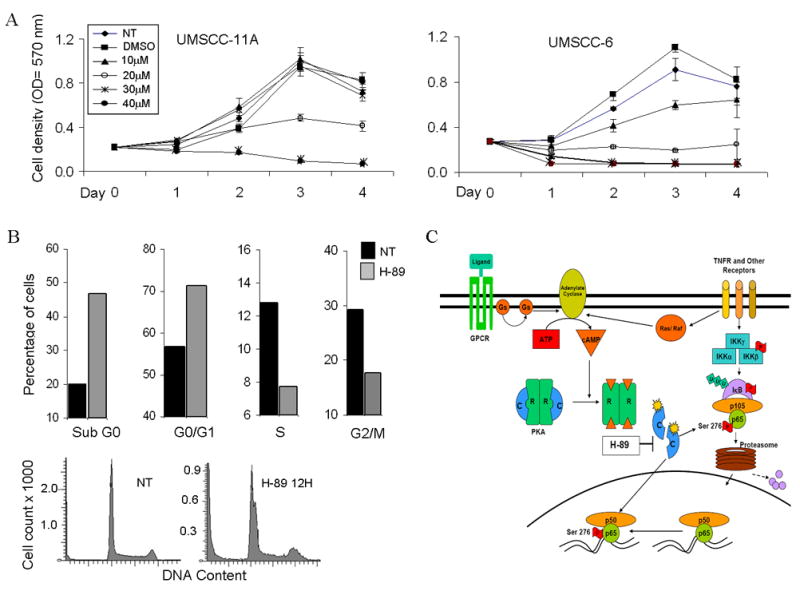
(A) UMSCC-11A and UMSCC-6 cells were treated with different concentrations (10 to 40μm) and proliferation of cells measured using the MTT assay for 4 days after addition of drug. Optical density values were plotted on the X axis for the corresponding days. No treatment and DMSO treated samples were run as controls for comparison. Values shown are an average of three independent observations. (B) DNA cell cycle analysis following treatment of UMSCC-6 cells with 20μM H-89 for 12 hours. Cells were counted and stained with propidium iodide (PI) and cell cycle analysis was done on 20,000 events. Graph shows distribution of cells in various phases of the cell cycle expressed as a percentage, compared with no treatment controls at 12 hours. (C) Model for PKA and phospho-ser276 activation in HNSCC. Ligand binding to TNF receptor (TNFR) or G-Protein Coupled Receptors (GPCR) activating stimulatory G-proteins Ras or Gs activates adenylate cyclase causing accumulation of cAMP. Active PKA catalytic subunits (c) are released following cAMP binding to the regulatory subunits. The active catalytic subunits phosphorylate targets both in the cytoplasm and in the nucleus, including p65 which is phosphorylated at the Ser-276 site. This site specific phosphorylation permits complex formation with transcription activating proteins and modulates NF-κB dependent gene expression.