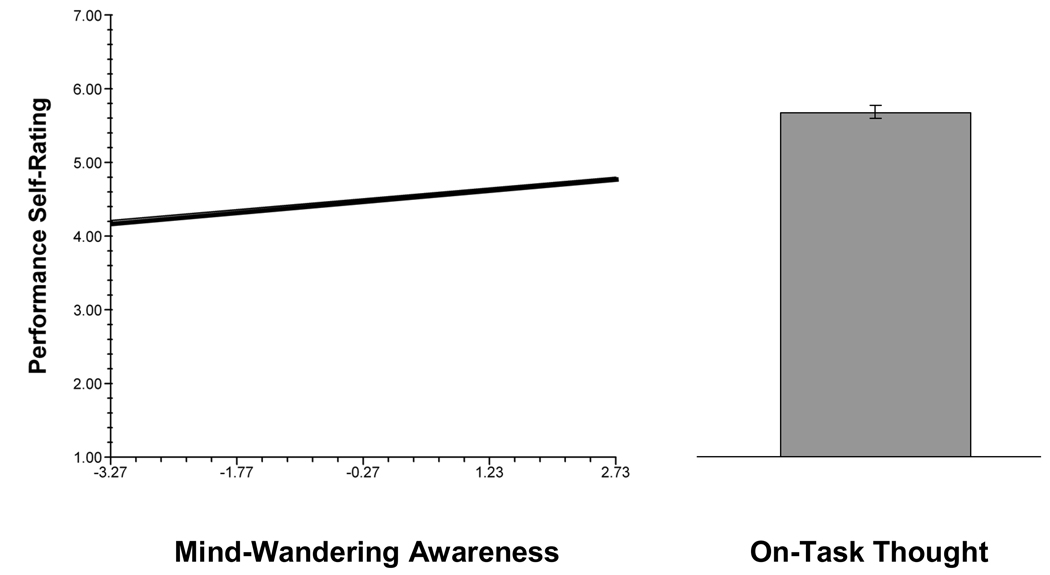
Figure 4.
The relation between daily-life performance and thought. Values on the y-axis represent ratings for success in performing one’s ongoing activity, scored on each questionnaire on a 1 – 7 scale (higher values indicate better performance). The line graph depicts the relation between performance and subjects’ awareness that they had been mind wandering; values on the x-axis represent group-centered ratings for awareness (“I was aware my mind was wandering in the moments before the beep.”). The bar graph depicts the M performance rating on occasions when subjects reported on-task thoughts.

