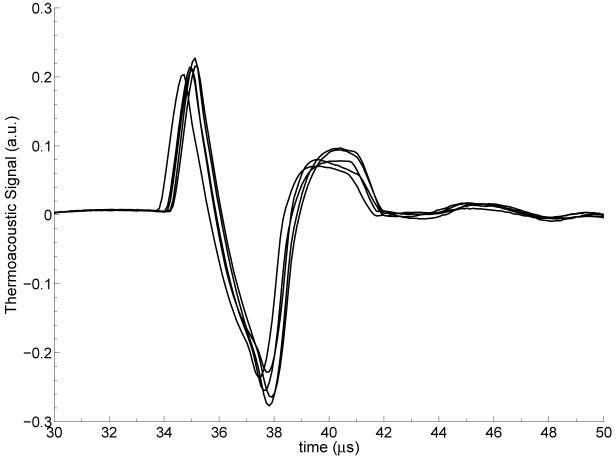
Figure 3.
Thermoacoustic temporal waveform of Solution 1 for five independent trials. The waveform shown for each trial represents an average of 200 measurements. The small variations observed across waveforms reflect slight differences between trials (e.g. small differences in the plastic tubes and their positions).

