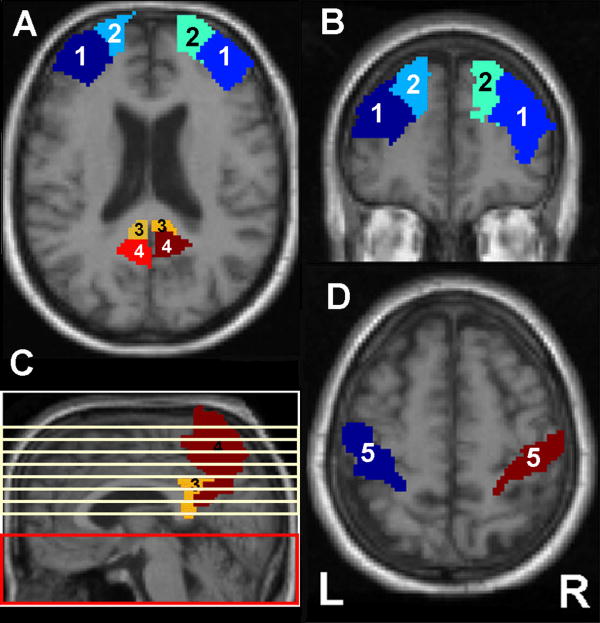
Figure 2.
A. Example of middle frontal (1), superior frontal (2), posterior cingulate (3), and precuneus (4) ROIs on an axial image. B. Example of middle (1) and superior (2) frontal ROIs on a coronal image. C. Example of posterior cingulate (3) and precuneus (4) ROIs on a sagittal image. The red box indicates the brain region where pulsed arterial spin labeling (ASL) occurred while the yellow lines represent the 7 slices where ASL MR data was acquired. D. Example of postcentral ROI (5) where mean perfusion values were extracted for use as covariates to adjust for global variations of perfusion.

