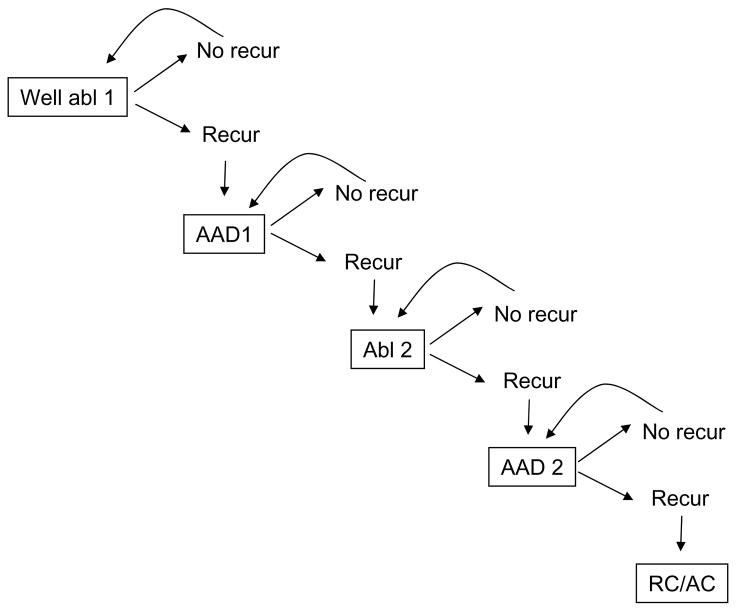
Figure 2.
Ablation Markov process. This simplified diagram demonstrates the major health states (boxes) and possible transitions between health states (arrows) in the ablation limb of the decision tree. In each state, patients face a finite risk of age-associated mortality (not shown). Otherwise, patients experiencing symptomatic recurrence of AF (or drug toxicity) progress to the next treatment, and patients remaining in sinus rhythm continue in the same state.

