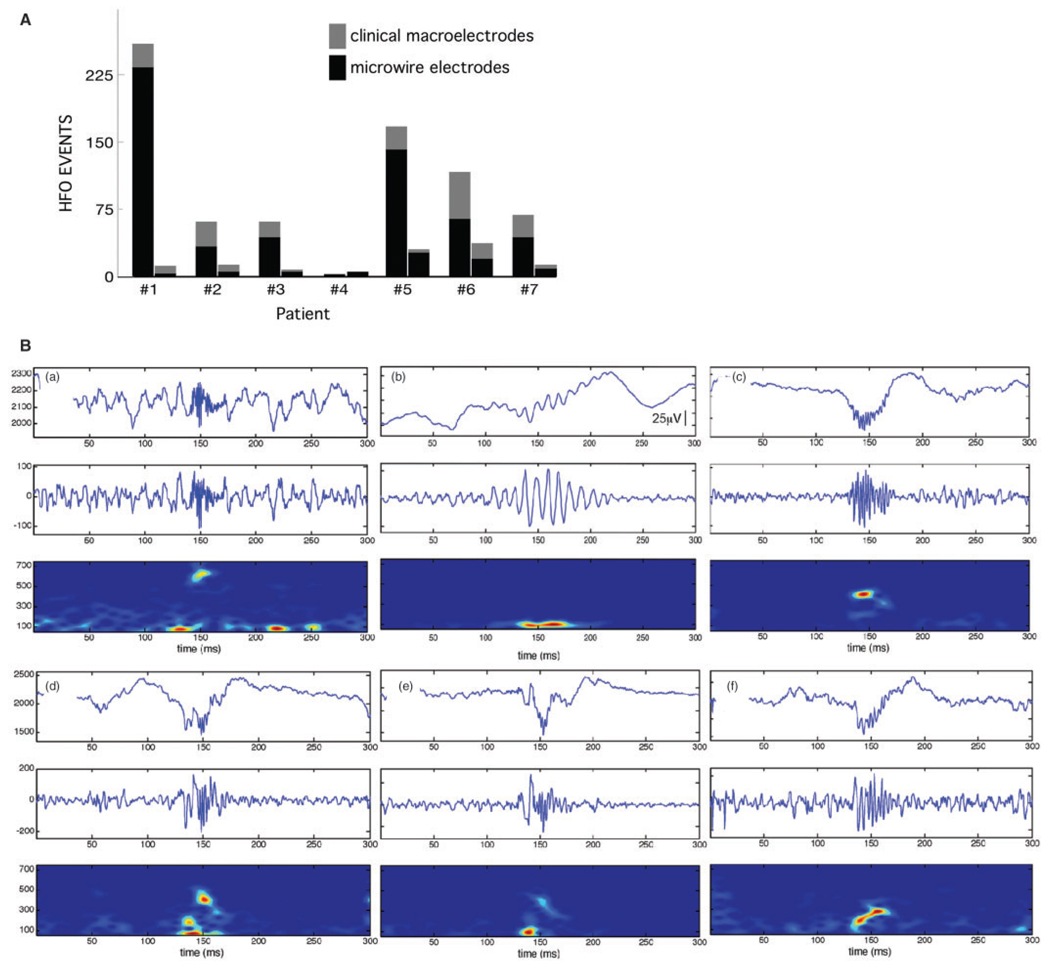
Fig. 4.
(A) The total number of verified HFO (ripple and FR) for each patient (n =7) in the SOZ and non-SOZ. (B) Representative HFO examples. Each plot shows three views of HFO activity over a 300 ms epoch: (top) unfiltered EEG with an HFO event centred at 150ms, (middle) high-pass filtered EEG (80–1000Hz), (bottom) spectrogram (2.6 ms window). Note that HFOs are primarily characterized by a sharp spectral mode in the FR (a) or ripple frequency range (b). However, many HFOs exhibit more complicated time–frequency structure (c– e), with high-frequency onset followed by slowing of the frequency of the oscillatory event, or conversely ripple frequency at onset that evolved to higher frequency (f). The spectral complexity of these HFEO events highlights the difficulty assigning a single representative frequency.

