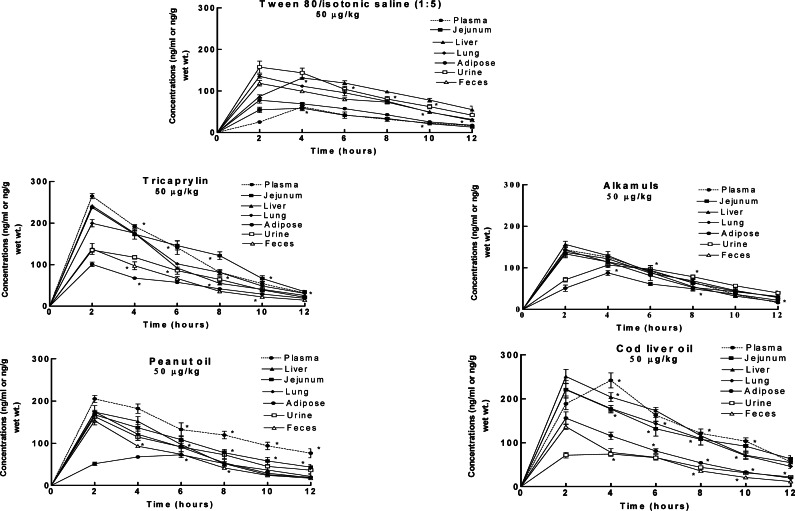
Figure 4:
Effect of dosing vehicle on time-course distribution of fluoranthene (FLA) metabolite concentrations in plasma, jejunum, feces, liver, lung, adipose, urine and feces of F-344 rats that received 50 μg FLA/kg body wt. via oral gavage. Values represent mean ± SE (n = 6). Asterisks denote statistical significance (p < 0.05) at the respective time point compared to 2 hour post-exposure.

