
Figure 1.
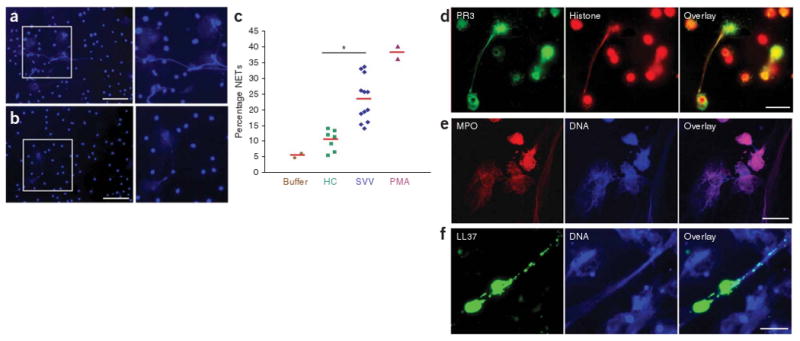
ANCA-induced formation of NETs containing autoantigens PR3 and MPO. (a,b) Fluorescence imaging of isolated tumor necrosis factor-α–primed neutrophils incubated with ANCA IgG (a) and control IgG (b) and stained for DNA. Scale bars, 50 μm. (c) Quantification of NET formation by fluorescence microscopy analysis. The percentage of cells with enlarged nuclei producing extracellular DNA fibers after 180 min incubation with buffer control, IgG from healthy controls (HC; n = 7), IgG from individuals with SVV (n = 12), or PMA as positive control is shown. Red horizontal bars indicate average percentage of each group. *P < 0.05. (d–f) Immunofluorescence analysis of autoantigens and immunostimulatory LL37 on PMA-induced NETs. (d) Immunofluorescence analysis of NETs stained with histone-specific antibody (red) and PR3-specific antibody (green). (e) Immunofluorescence analysis of NETs stained with MPO-specific antibody (red) and DNA stained with Hoechst dye (blue). (f) Immunofluorescence analysis of NET-forming neutrophils stained with LL37-specific antibody (green) and DNA stained with Hoechst dye (blue). Scale bars, 5 μm.