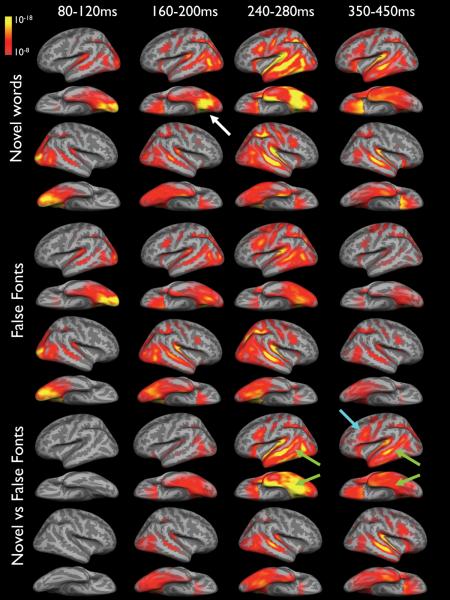
Figure 1.
Average dynamic statistical parametric maps of cortical responses to novel words (top), false fonts (middle), and the novel words vs false fonts (bottom) for 10 healthy controls. Activity is seen bilaterally in occipital cortex ~80-120ms. By ~160ms, activity to novel words peaks in the left ventral occipital-temporal area (white arrow). By ~240ms, activity is observed within the left superior, middle, and inferior temporal lobe, in addition to left prefrontal cortex and is greater for novel words relative to false fonts. Activity is also seen within the right temporal lobe by ~240ms in both conditions. By ~350 ms, activity to novel words remains left lateralized in temporal cortex, but is bilateral in multiple frontal regions. The bottom panel demonstrates the absolute power differences in the mean waveforms. As can be seen, there is an absence of activity in this subtraction condition from ~80-120ms. This initial response was followed by a left-lateralized pattern of activity after ~240ms in left temporal (green arrows) and prefrontal (blue arrow) believed to reflect lexical, syntactic, and semantic processing. In each condition, significance thresholds are set at a minimum of p < 10-8 (full red), with p< 10-18 indicating peak activity (full yellow). These values represent significance levels associated with the noise-normalized dipole strength and can be conceptualized as estimates of the signal-to-noise at each vertex.

