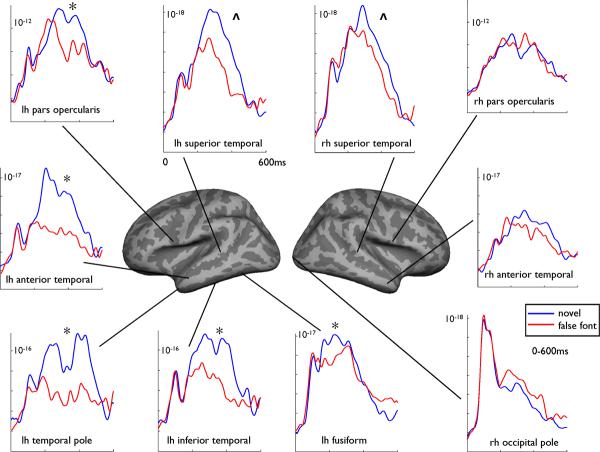
Figure 2.
Noise-normalized dipole strengths from 0-600ms for novel words (blue) and false fonts (red) within selected regions of interest for the healthy control group. Significance (*) denotes regions producing a significant condition x hemisphere interaction. Main effects of condition are indicated by (“ ^ ”).

