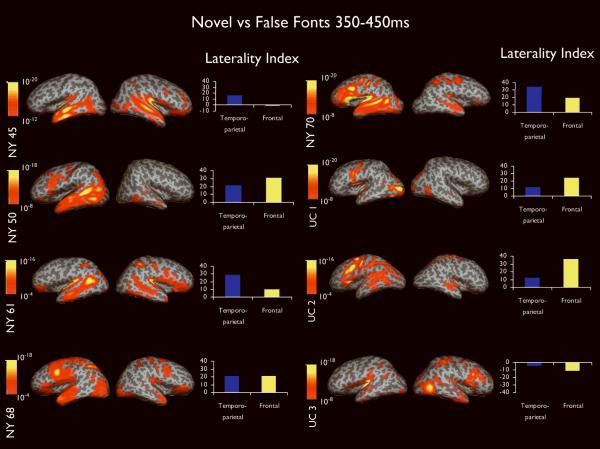
Figure 4.
Dynamic statistical parametric maps and laterality indices calculated from 350-450ms for each of the eight patients. Activity is displayed on the inflated surface of each hemisphere. Sulci and gyri are shown in dark and light gray, respectively. Color bars range from moderate (orange) to high (yellow) activity and are relative to each patient's baseline. Values on the color bars represent significance values associated with the noise-normalized dipole strength at each vertex on the cortical surface. Laterality indices represent the difference between the hemispheres where positive values reflect greater left hemisphere activity and negative values greater right hemisphere activity.

