Figure 4.
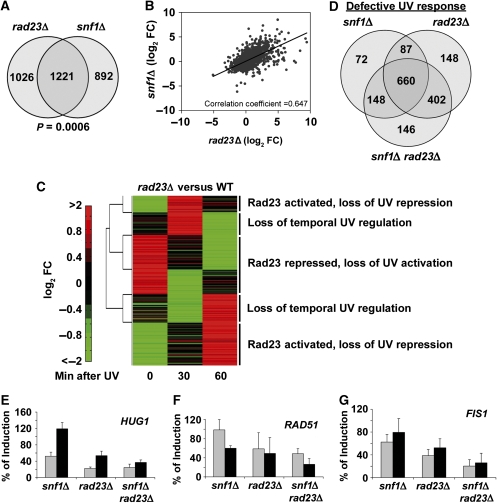
Rad23 regulation of Snf1-dependent, UV-responsive genes. (A) Venn diagram showing the number of genes significantly affected in snf1Δ and rad23Δ cells compared with WT cells in the absence of irradiation. (B) Correlation of snf1Δ and rad23Δ microarray data sets. For genes with a significant change in either snf1Δ or rad23Δ cells compared with WT, log-transformed FC in gene expression in snf1Δ cells was plotted against the log-transformed FC in rad23Δ cells and the correlation coefficient was calculated. (C) Two-dimensional hierarchical clustering performed on rad23Δ data as in Figure 1B. Five distinct clusters are indicated. (D) Venn diagram showing overlap in genes with a significantly different expression level after DNA damage compared with WT cells. (E–G) Induction level of HUG1, RAD51, and FIS1 in snf1Δ, rad23Δ and snf1Δ rad23Δ cells compared with WT. The graphs show relative RNA levels obtained by quantification of northern blots of total RNA isolated from the indicated strains at 1 h (grey bars) or 2 h (black bars) after irradiation with 100 J/m2 UV light. In each case, the expression level of the indicated gene at the indicated time in WT cells was defined as 100%. Labelled probes were specific for the HUG1 ORF (E), the RAD51 ORF (F), or the FIS1 ORF (G) and expression levels were normalized to ACT1 expression. For quantification of RNA levels over a more extended time course, see Supplementary Figure S5. Values are the average of three independent experiments and error bars represent standard deviation.

