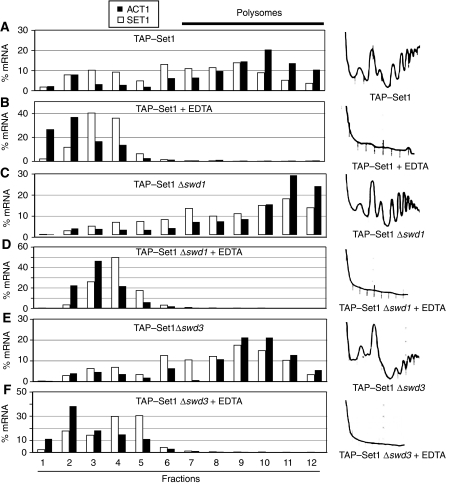
Figure 5.
Set1 translation continues in Δswd1 and Δswd3 strains. (A–F) Sucrose-gradient analysis of extracts prepared from strains expressing TAP–Set1 in the presence or absence of Swd1 and Swd3, as indicated. Extracts were prepared in the presence of 10 mM EDTA, as indicated, to disrupt ribosome association. RT–PCR analysis was carried out to detect ACT1 (filled black bars) and SET1 (open white bars) mRNAs. RNA levels were normalized to an unrelated control RNA (spike) that was added in equal amounts to individual fractions before RNA extraction. mRNA content is represented as % mRNA in relation to the total amount of mRNA present in all fractions. A254 nm absorption spectra obtained during collection of gradient fractions are shown on the right.

