
Figure 1.
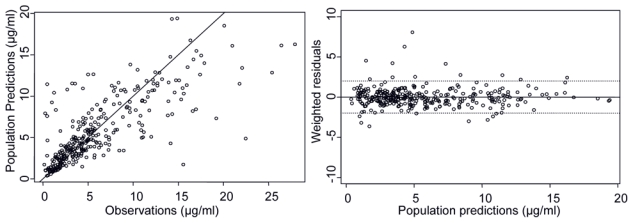
Goodness of fit plots of final PK model. Right plot: solid line represents identity line of population predictions and observation. On weighted residual plots, solid line define zero and dotted lines values for −1.96 and +1.96, the 2.5 and 97.5% quantiles of normal distribution.