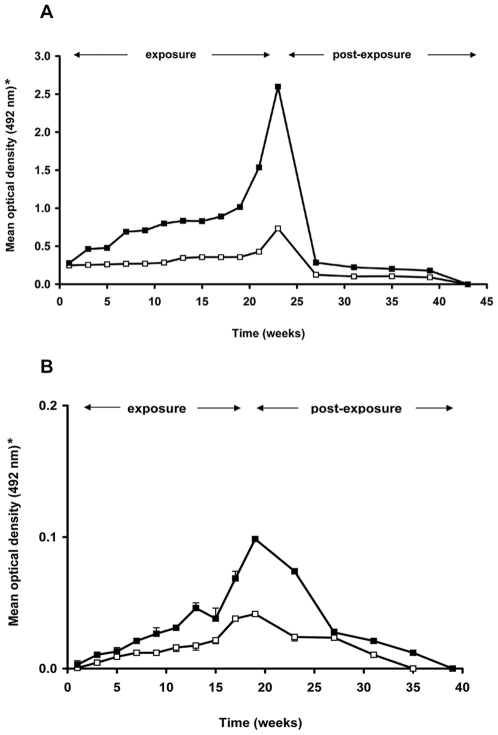
Figure 4. Evolution of serum IgG reactions to rTiSP14.6 during exposure and post-exposure period.
Reactivity to rTiSP14.6 was measured in sera from chickens (A) and guinea pigs (B) using ELISA. (*) Data presented are mean and standard deviation of optical densities of two series of measurements (assayed in triplicate) using sera from the low (open squares) and high (closed squares) exposure groups (exposure to 5 or 25 T. infestans per feeding, respectively).

