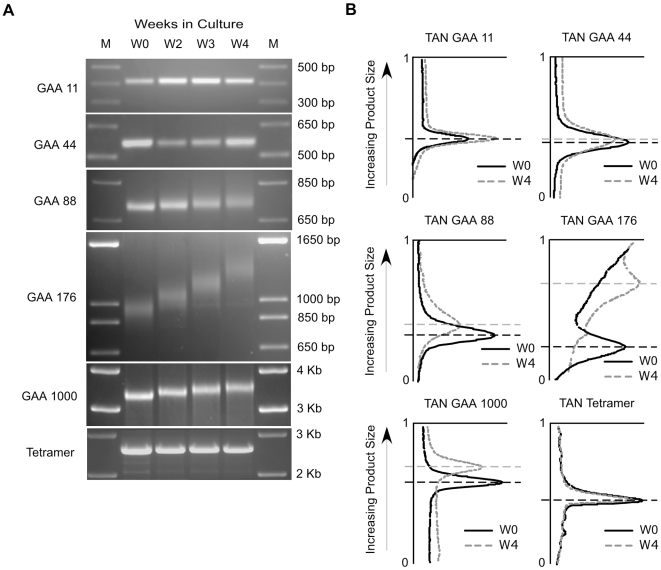
Figure 2. Expansion is specific to GAA·TTC repeats and is repeat length–dependent.
(A) PCR analysis of (GAA·TTC)11, (GAA·TTC)44, (GAA·TTC)88, (GAA·TTC)176, and (GAA·TTC)1000 inserts isolated at W0, W2, W3, and W4. The tetramer insert sequence is a 2.1 Kb semi-repetitive sequence controlling for the effects insert size on stability. PCR amplification adds 438 bp to the GAA·TTC and tetramer inserts. M: 1 Kb plus size standard. (B) Profile analysis of the insert PCR product mobility distribution. Profile analysis of inserts isolated at W0 and W4 are shown. The x-axis represents product signal intensity. The y-axis represents product mobility during electrophoresis. Dashed lines mark the mobility of the peak amplification signals at W0 and W4. Profile analysis was performed using Kodak Molecular Imaging software.

