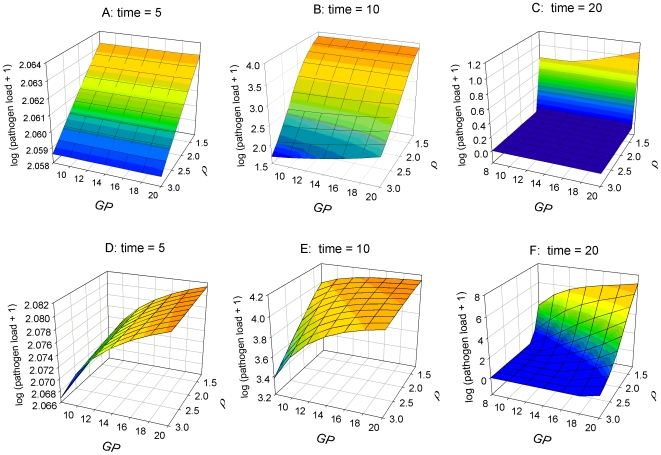
Figure 3. Effect of growth potential (GP) and resistance (ρ) on (log10 transformed) pathogen load at various times during infection.
Graphs A–C: High nutrient availability (N = 20); graphs D–F: Low nutrient availability (N = 6). Values of other parameters are as in Figure 1. All units are arbitrary. Note that the value ranges for log (pathogen load+1) differ amongst individual graphs, as the value ranges have been chosen for illustration clarity.

