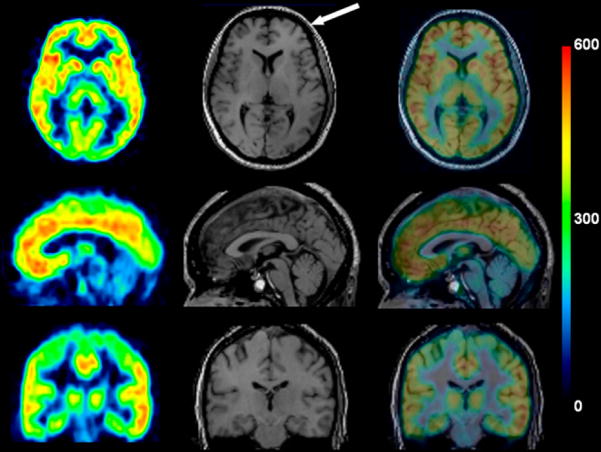
FIGURE 1.
PET and MR images from healthy subject. PET images from 60 to 180 min after injection of 18F-SP203 were summed; pixel values represent mean concentration of radioactivity (%SUV). Coregistered MR images are in middle column, and fused PET and MR images are in right column. Arrow points to subcutaneous fat, which has high signal intensity on this T1-weighted image. Skull lies in dark area between this high-intensity signal and brain.

