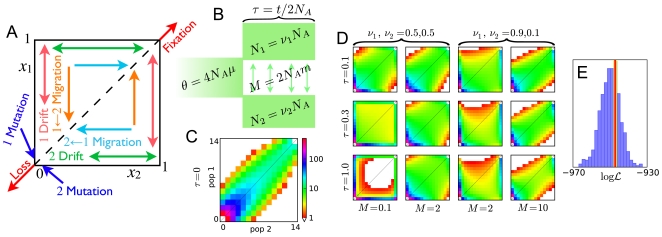
Figure 1. Frequency spectrum gallery.
(A) Qualitative effects of modeled neutral genetic forces on  , the density of alleles at relative frequencies
  and
and  in populations 1 and 2. (B) For the spectra shown, an equilibrium population of effective size
  diverges into two populations
  generations ago. Populations 1 and 2 have effective sizes
  and
and  , respectively. Migration is symmetric at
  per generation, and
  . (C) The AFS at
  . Each entry is colored by the logarithm of the number of sites in it, according to the scale shown. (D) The AFS at various times for various demographic parameters, on the same scale as (B). (E) Comparison between coalescent- and diffusion-based estimates of the likelihood
  of data generated under the model (A). Coalescent-based estimates of the likelihood, each of which took approximately 7.0 seconds, are represented in the histogram. The result from our diffusion approach, which took 2.0 seconds, is represented by the red line. For accuracy comparison, the yellow line indicates the likelihood inferred from
  coalescent simulations.

