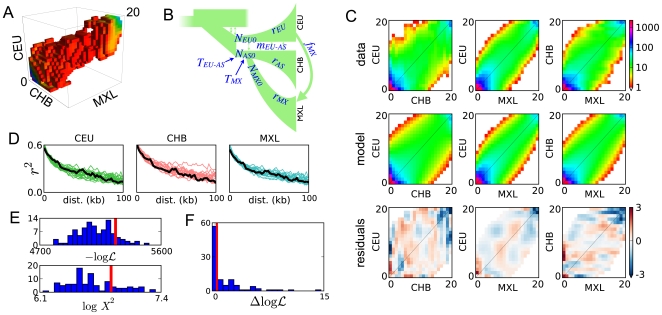
Figure 3. Settlement of the New World analysis.
As in Figure 2, (A) is the data, (B) is a schematic of the model we fit, (C) compares the data and model AFS, and (D) compares LD. (E) The fit of our model to the real data is not atypical of fits to simulated data. (F) The improvement in real data fit upon including CHB-MXL migration (red line) is very typical of the improvement in fits to simulated data without CHB-MXL migration. Thus we have no evidence for CHB-MXL migration after divergence.

