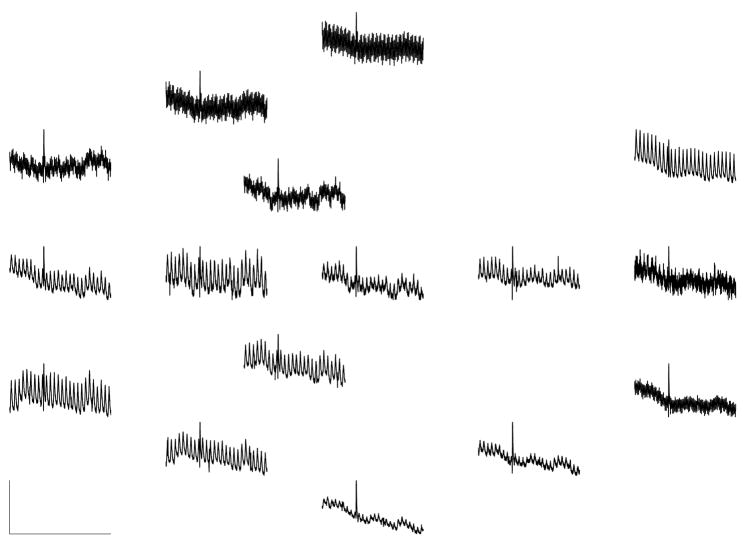
Fig. 3.
Sample MENG recordings from 16 sensors. Vertical scale bar: 7.1 pT. Horizontal scale bar: 60 sec. Although we analyzed 120-second segments of data, a 60-second recording is shown here for clarity. The large oscillation (26 cpm, ≈ 2–7 pT) that dominates on most sensors is due to respiration of the test subject. Slow drift is also noticeable in many of the sensors. The large spike at t = 24 sec is probably due to a transient external signal, such as a metal door opening outside the laboratory.

