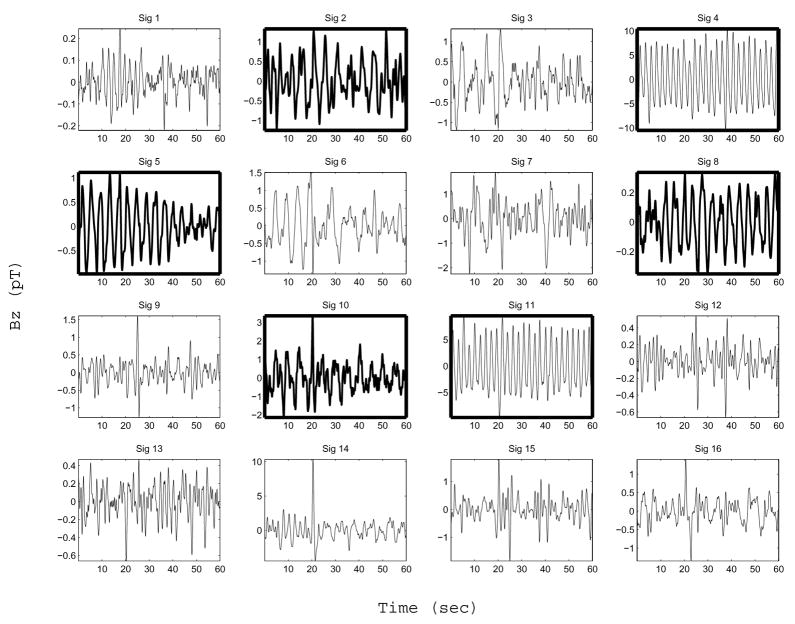
Fig. 5.
SOBI components. Although we analyzed 120 second-long data segments, only 60-second segments are shown for clarity. Boxes in bold mark components which are well-described as a sinusoid containing a single dominant frequency (according to the criterion described in section III-D). The subset of bold boxes that contain a waveform also drawn in bold are components identified as being enteric in origin (Sig 2, 5, 8, and 10). The two non-bold waveforms in bold boxes are attributed to respiration (Sig 4 and 11). See text regarding the origin of the other SOBI components. Each component shown has been scaled by the maximum value contained within the corresponding column vector of the mixing matrix—i.e. maxi |a⃗ij |·sj.

