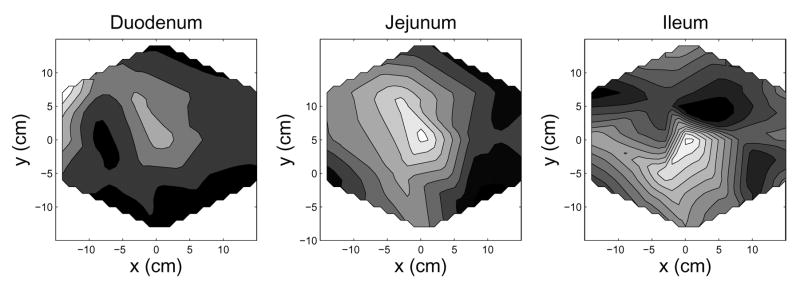
Fig. 8.
Spatial Intensity contour maps show the relative location (focus) of the each bowel section. These spatial intensity maps were created for each bowel section by projecting an averaged column vector back onto the SQUID sensor array: a⃗avg = Σk a⃗γk (tk) where a⃗γk is the column vector from Ak (the SOBI mixing matrix computed at time point tk), and γk indexes the column number corresponding to the SOBI component of enteric origin. In the gray scale contour maps white is higher-intensity; black is less-intensity. The positions noted for each bowel section are consistent with the known physiology and aboral frequency gradient of the small bowel.

