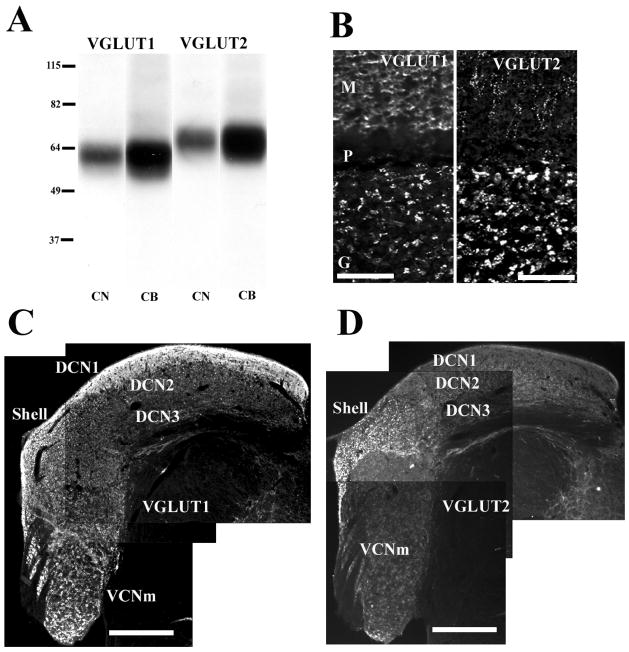
Figure 3.
VGLUT1 and VGLUT2 show distinct expression in the CN. (A): Western blot analysis of proteins from CN and cerebellum (CB) with anti-VGLUT1 and anti-VGLUT2 antibodies. Anti-VGLUT1 antibody is recognized a single band at ~60 kDa, and anti-VGLUT2 antibody is recognized a single band at ~65 kDa, corresponding to the molecular weights predicted for VGLUT1 and VGLUT2, respectively. Molecular weight standards are indicated at left (kDa). (B): VGLUT1-ir and VGLUT2-ir in the cerebellar cortex, as a positive control (M, molecular layer; P, Purkinje cell layer; G, granular layer). (C): VGLUT1-ir in the CN at low magnification (x10). VGLUT1 is intensely expressed in DCN1 and VCNm; weak to moderate VGLUT1-ir is found in the shell and DCN2; weak VGLUT1-ir is seen in DCN3. (D): VGLUT2-ir in the CN at low magnification (x10). VGLUT2 is expressed predominantly in the shell; moderate VGLUT2-ir is found in DCN2; very weak to weak staining is found in DCN1, VCNm, and DCN3. Scale bars = 50 μm in (B); 0.5 mm in (C), (D). (Adapted with permission from Zhou et al., 2007)

