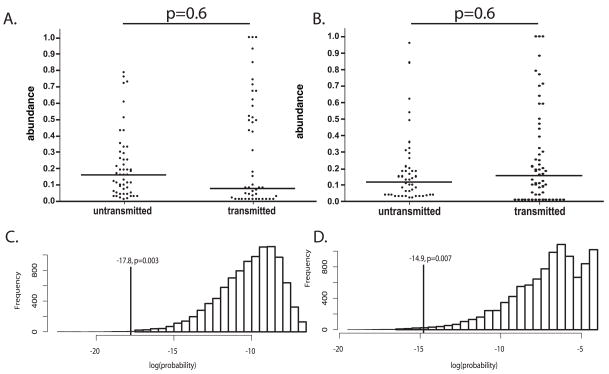
Figure 3. HIV-1 envelope V1/V2 Variant Transmission.
The proportional abundance of each maternal V1/V2 variant was determined by the heteroduplex tracking assay and quantified by phoshorimaging. Graphed are the abundances of the transmitted versus untransmitted variants in the A) IU mother-infant pairs, and B) IP mother-infant pairs. Transmitted variants that were undetected in the maternal viral population were assigned a relative abundance of 0.01. The solid horizontal line represents the median abundance per group. Histogram of the probability of transmission obtained from random sampling, for both C) IP and D) IU transmissions, we sampled from the variant distributions described by the mothers’ HTAs according to their abundance in order to mimic a stochastic transmission process. Shown are the summed log probabilities (see Methods) for 10,000 such samples. The probability of the observed data is indicated by a vertical line. The fraction of the random samples attaining a probability equal to or less than the observed data is indicated.

