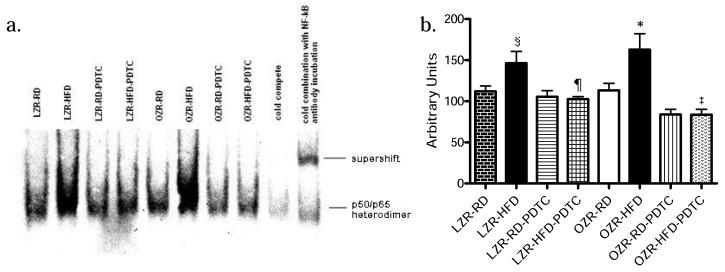
Figure 6.
(A) Nuclear NFκB p65 DNA binding activity in LZR and OZR kidney cortex. The DNA-protein complex was resolved from the free-labeled DNA by electrophoresis on a 5% (W/V) native polyacrylamide gel. (B) Densitometric analysis of EMSA bands. Values are expressed as mean±S.E.M. Statistical analysis was performed using one way ANOVA followed by a post hoc Bonferroni procedure. P ≤ 0.05 was considered significant. §p < 0.05 LZR-RD Vs LZR-HFD, ¶ p < 0.05 LZR-HFD Vs LZR- HFD-PDTC, *p<0.05 OZR-RD vs. OZR-HFD; ‡p<0.05 OZR-HFD vs. OZR-HF-PDTC.

