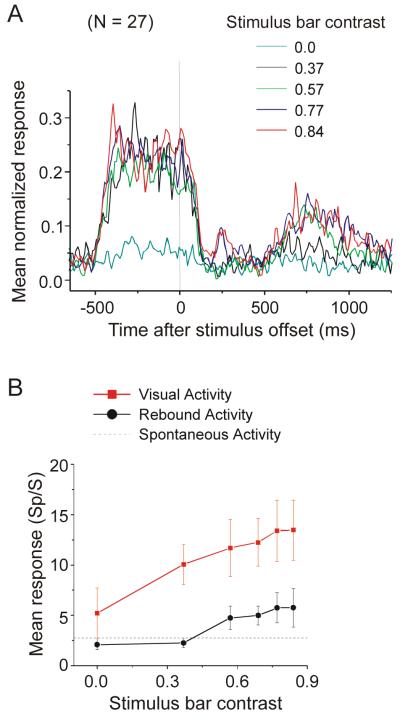
Figure 2.
Effect of stimulus contrast on neural activity. A. Averaged normalized PSTHs of 27 neurons in response to a stimulus bar with different luminance contrasts. The magnitude and duration of the rebound activity increased as contrast increased. At contrast levels of 0.77 and 0.84, an additional early activity peak was found about 200 ms after stimulus offset. Responses are aligned at stimulus offset. B. Mean visual responses calculated 0 to 500 ms after stimulus onset (red symbols) and mean rebound activity calculated 500 to 1000 ms after stimulus offset (black symbols). Both visual responses and rebound activity increased with contrast. Mean spontaneous activity across the 27 neurons is indicated by the dashed line.

