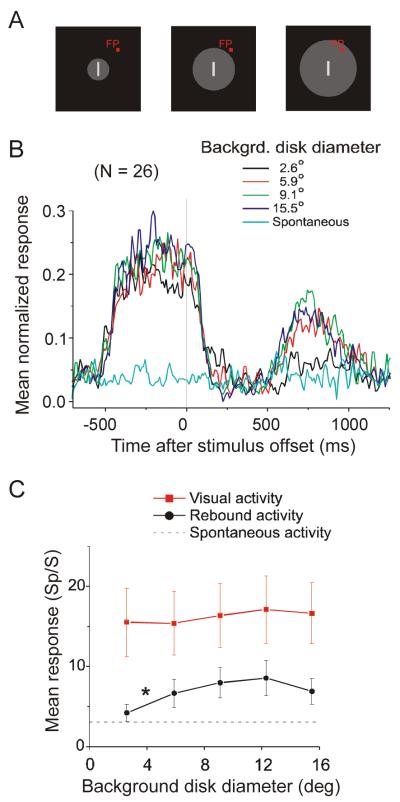
Figure 5.
Rebound activity depends on background size. A. The gray background varied in size from 2.6° to 15.5°. B. Averaged normalized PSTHs of 26 neurons as background size varied. To avoid excessive clutter, responses to only 4 of the 5 background sizes are shown. C. The mean firing rates of the visual responses were calculated 0 to 500 ms after stimulus onset (red symbols) and the mean rebound activities were calculated 500 to 1000 ms after stimulus offset (black symbols). With a diameter of 2.6°, rebound activity was significantly weaker than with larger disk diameters (indicated by the asterisk, see text), but visual responses did not differ. Mean spontaneous activity across the 26 neurons is indicated by the dash line.

