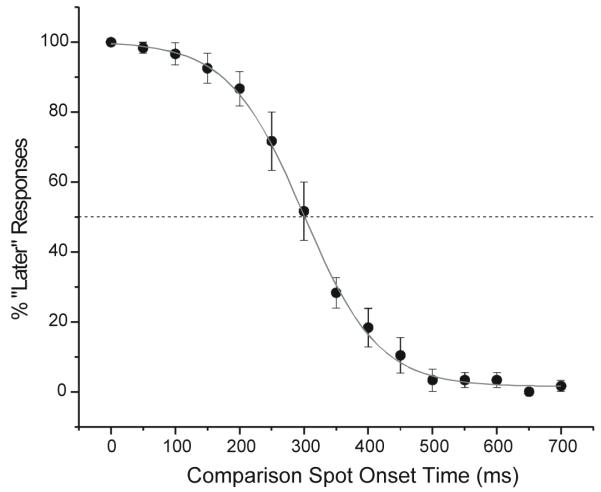
Figure 9.
Timing of a delayed aftereffect in humans. Subjects indicated whether the aftereffect, perceived with simultaneous bar and background offset, appeared before or after a comparison spot presented at different times. When the comparison spot was presented shortly after stimulus offset, subjects reported that the aftereffect was seen later than the comparison spot (left side of graph). At 300 ms after stimulus offset, 50% of the subjects’ responses said the aftereffect was earlier or later than the comparison spot. The data are averaged over 4 subjects and error bars show standard errors.

