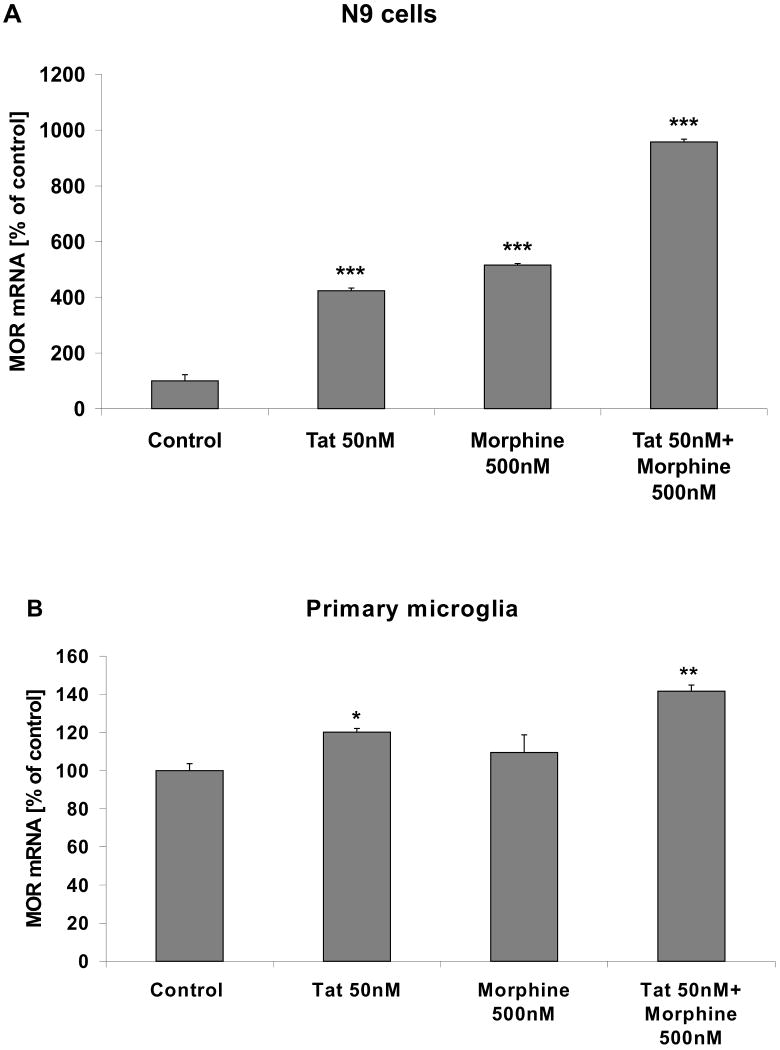
Figure 5. Effects of Tat and morphine on MOR mRNA expression in microglia.
Cultured (A) N9 microglial cells and (B) primary microglia were grown as described in Methods, and treated with vehicle, 50 nM Tat and/or 500 nM morphine for 24 h as described in Methods. Cells were then harvested, mRNA extracted, and MOR expression was analyzed by real-time PCR as described in Methods. Data were analyzed by ANOVA, and *, **, *** indicate statistically significant differences (p<0.05, p<0.01, and p<0.001, respectively) in mRNA expression compared to vehicle-treated (control) microglia.

