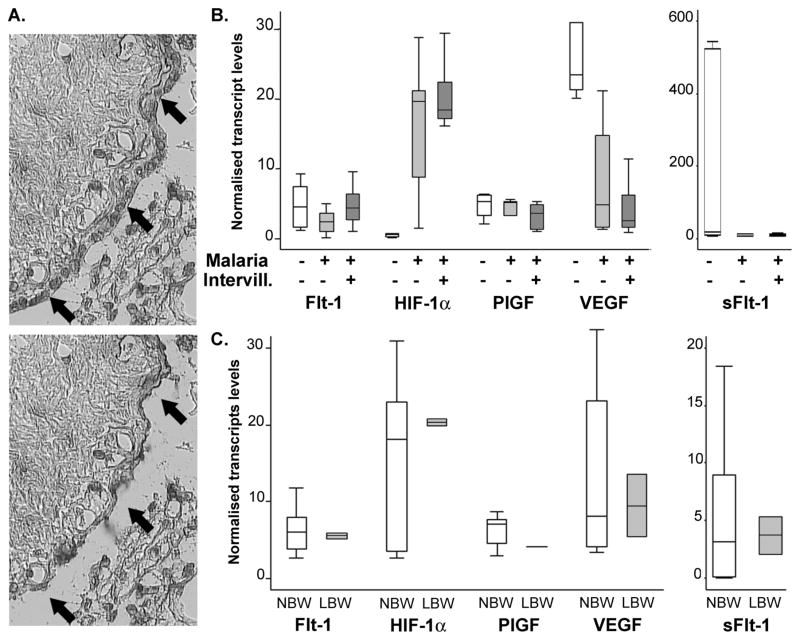
Figure 3. SCT-specific transcription profile using laser capture microdissection.
A. Syncytiotrophoblast was specifically captured from cryosections of placental tissue using laser capture microdissection and its transcription profile was determined by quantitative real time RT-PCR normalised to the expression of a placental housekeeping gene. B. Controls (open bars, n=6), malaria cases without intervillositis (light grey bars, n=7) and cases with monocyte infiltrates (dark grey bars, n=10) were compared. C. Participants with normal birth weight (NBW, open bars, n=21) and LBW cases (grey bars, n=2) had similar transcription profiles. P>.05 Mann-Whitney’s test. Bars represent median, 25th and 75th percentiles and the whiskers are 5th and 95th percentiles. Flt-1: VEGF receptor 1; HIF: Hypoxia-inducible factor; PlGF: Placental growth factor; VEGF: Vascular endothelial growth factor; sFlt-1: soluble Flt-1; Intervill.: intervillositis.

