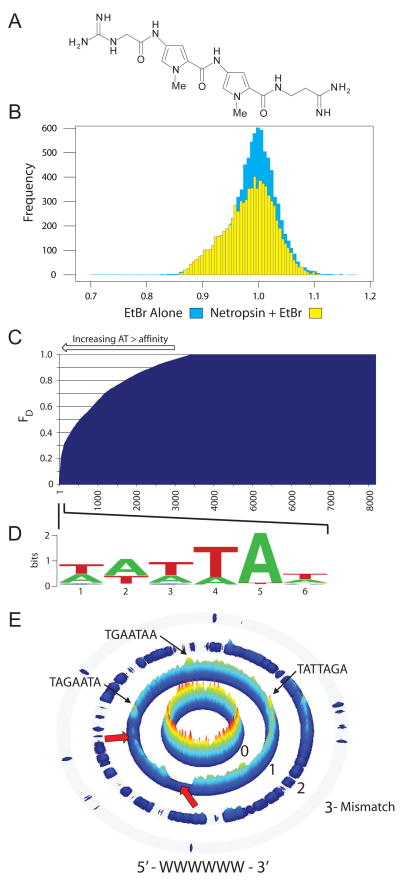
Figure 2. CSI-FID analysis of the small molecule DNA ligand netropsin.
A. The structure of netropsin. B. Histograms of the intensities derived from CSI-FID with EtBr (blue) and EtBr + netropsin (yellow). On the left side of the histogram the yellow region shows the displacement of EtBr by netropsin, green shows overlap between both arrays. C. A displacement display of all 7mer probes (using FD = 1−(1−Rseq)/(1−RMax), where Rseq is determined using the ratio derived from the displaced and undisplaced EtBr intensities of the sequence, and RMax is the ratio of the sequence with the highest fluorescent displacement). This display shows a clear trend of a preference of netropsin for increasingly AT-rich DNA. D. A logo diagram constructed from top netropsin DNA binding sequences (bracket). E. A sequence specificity landscape (SSL) display generated for the motif 5′-WWWWWW-3′ (W = A/T). SSLs display sequences that match the consensus on the inner ring, with mismatches to the consensus on the outer rings. The height of each sequence is calculated using 1-FD. Netropsin shows a clear preference for regions of DNA with greater than 4 bp AT stretches of DNA (center ring red and yellow peaks, 1 mismatch ring ridgeline and peaks). The valleys indicated by the red arrows in the 1 mismatch ring are regions of weak netropsin DNA binding and are dominated by sequences which contain 2–3 bp AT stretches (WWSWWW or WWWSWW).

