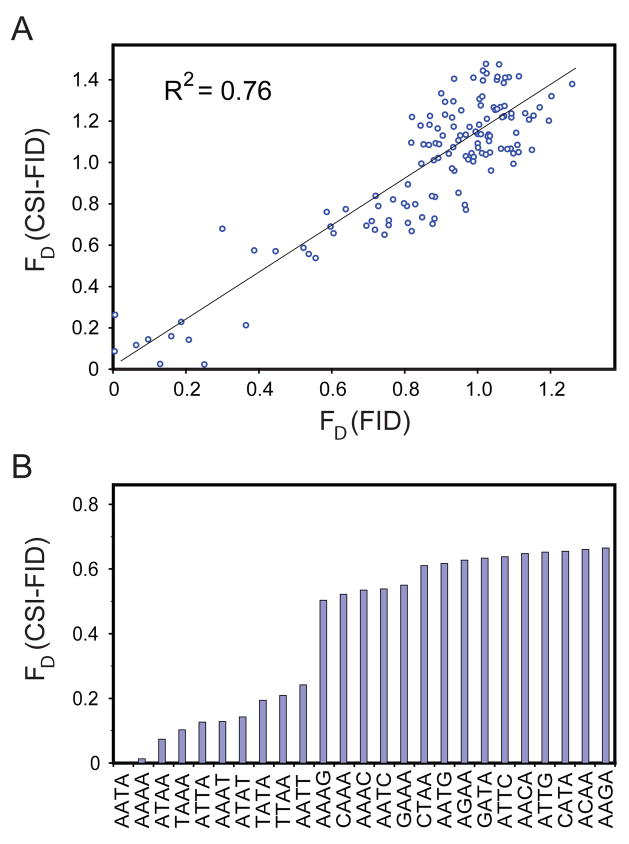
Figure 3. A comparison of netropsin data from the solution-based FID assay to the CSI-FID assay.
A. A correlation plot of all 4mer DNA sequences for both CSI-FID versus FID. The plot shows a clear correlation (R2 = 0.76) between the two netropsin datasets and demonstrates that the data obtained from CSI-FID are not affected by any possible surface based effects. B. A displacement display for the 4mer CSI-FID data showing a distinct step when moving from sites with 4 AT stretches (10 sites) to sites with 3 and 2 bp AT stretches.

