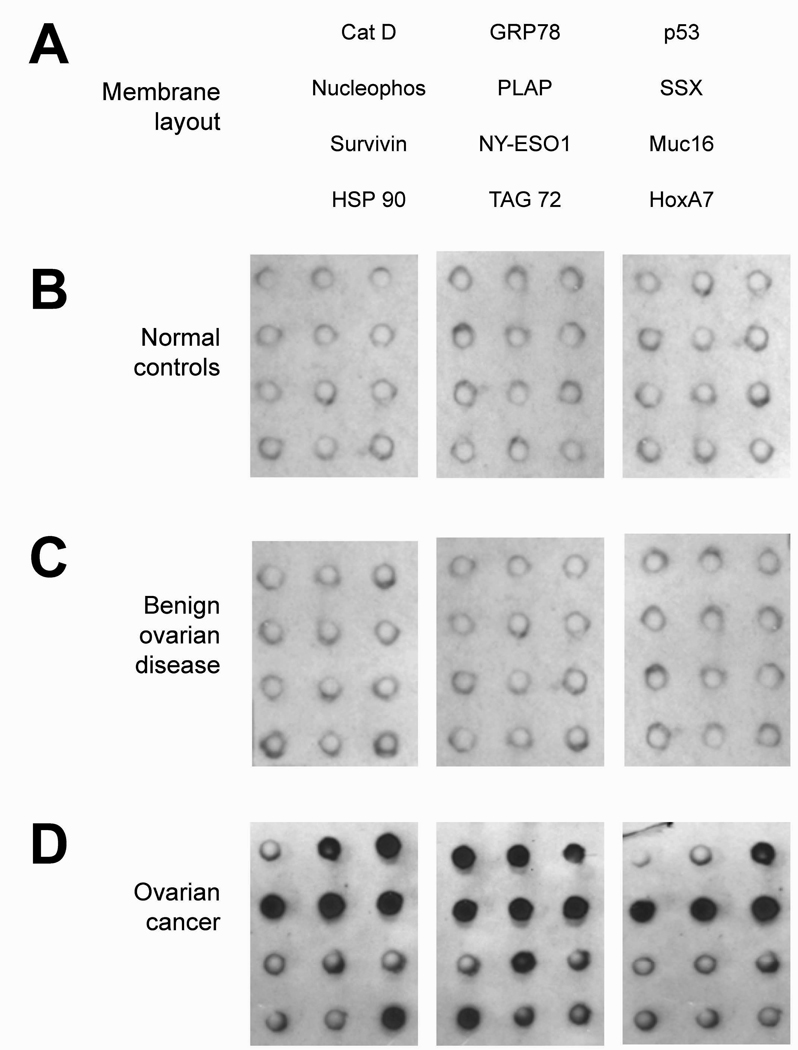
Figure 3.
Protein array from the assessment of immunoreactivity of patient sera. Panel A presents the array layout. Panel B shows 3 representative dot blots using sera from normal female controls. Panel C presents 3 representative dot blots using sera from patients with benign ovarian disease, while Panel D shows 3 representative dot blots using sera from ovarian cancer patients.

