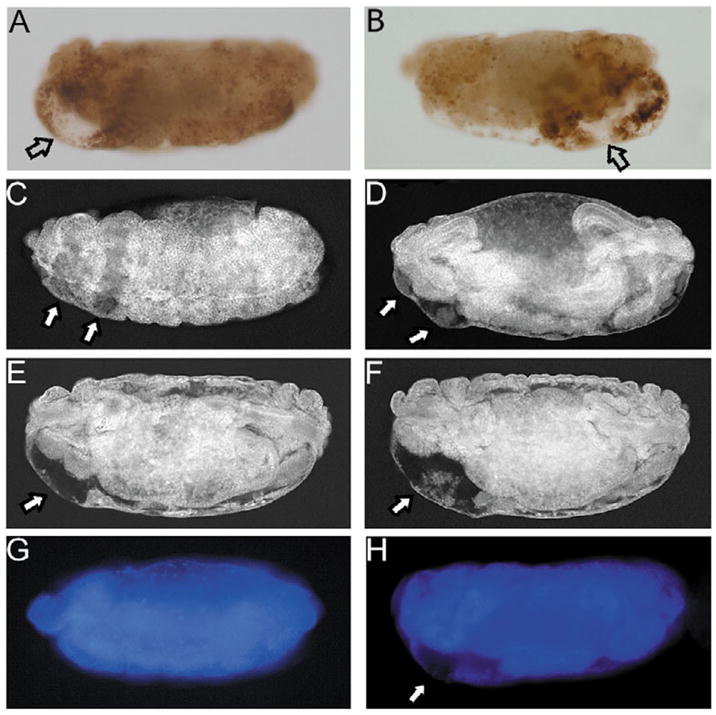
Fig. 2.

Development of the areas of clearance. (A,B) CM1 labeling of stage 15 bicoid (A) and oskar (B) mutants. Open arrows indicate areas of clearance. (C–F) Confocal images of lateral views of stage 14 (C), stage 15 (D), stage 16 (E) and stage 17 (F) bicoid mutants stained with anti-Discs large (Dlg) antibody to visualize cell outline. Clearance of tissue is initially detectable in two distinct zones (see arrows in C and D), but becomes broader over time, fuses (E) and enlarges (F). Similar results were obtained for oskar (not shown). (G,H) DAPI staining of wild-type (G) and bicoid (H) mutants to visualize chromosomal DNA. The areas of clearance (arrow in H) do not contain DNA.
