
Figure 5.
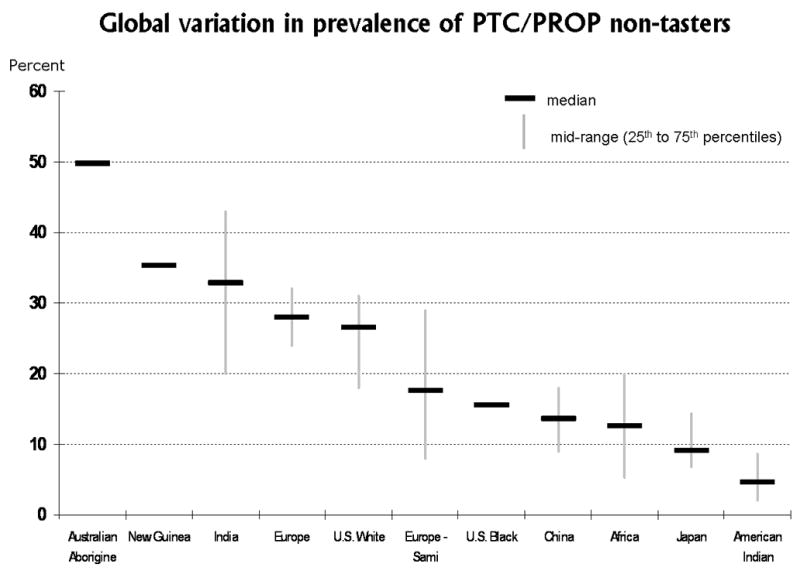
Global variation in sensitivity to the bitter taste of phenylthiocarbamide (PTC), or a related chemical compount, 6-n-propylthiouracil (PROP). The median and mid-range of percentages of non-tasters within each nationality or ethnic/racial group is plotted. The highest percentages of PTC non-tasters were reported for Australian Aborigines (plotted on the left side), while the lowest percentages of non-tasters were reported for Native American Indian groups (plotted on the right side). Data for this figure were extracted from a published table that summarized findings from tests conducted in more than 370 study samples worldwide, all published between 1934 and 1998.68