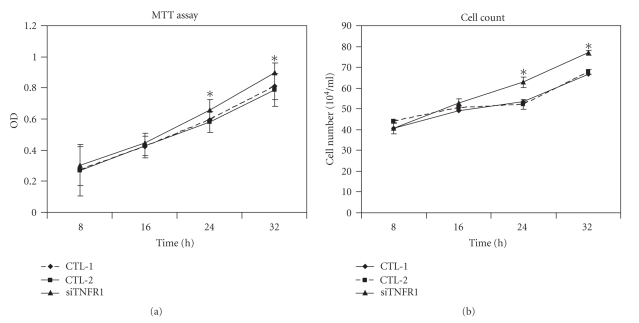
Figure 3.
Silencing of the TNFR1 gene resulted in increased EC109 cell growth as determined by the MTT analysis (a) and cell count (b). CTL-1: blank control group; CTL-2: negative control group; Si-TNFR1: experimental group. The results show that the levels of proliferation between CTL-1 and CTL-2 were similar (P > .05); the levels of proliferation between CTL-1 and Si-TNFR1 were significantly different for the 24-hour and 32-hour time points (P < .05). Data represent the mean ± SD values of three experiments.

