
Figure 4.
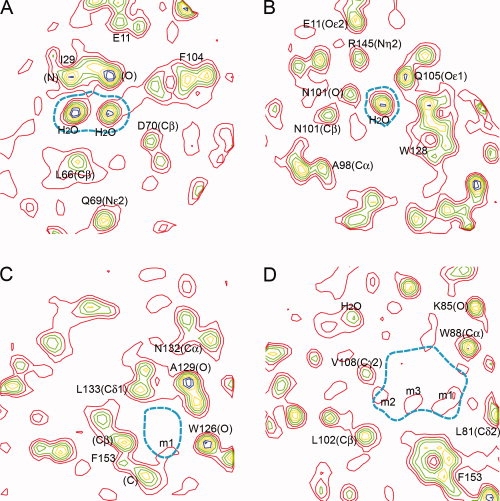
Electron density based on experimental phases to 1.2 Å resolution for the cavity-containing lysozyme mutant L99A/M102L (Liu et al., 2008). The four panels show, respectively, sections of electron density passing through the four cavities in this lysozyme mutant. The boundary of the cavity in question is indicated in dashed cyan. The electron density, starting in red and continuing through blue, is contoured at 0.55, 1.0, 1.45, 1.9, 2.35, 2.8, 3.25, and 3.7 e/Å3. Density corresponding to selected atoms is labeled. A: The density confirms the presence of two well-ordered solvent molecules in this polar cavity. B: Second polar cavity with a single water molecule bound. C: The very weak density in this apolar cavity (labeled m1) indicates that the occupancy by solvent is close to zero. D: The engineered L99A cavity contains weak electron density indicating that the overall occupancy of this cavity is about 1.5 water molecules. The features labeled m1–m3 could indicate a chain of weakly occupied solvent molecules transiently H-bonded to each other and to the carbonyl oxygen of Ala99 in the wall of the cavity. Figure prepared by Mapman (Kleywegt and Jones, 1996).