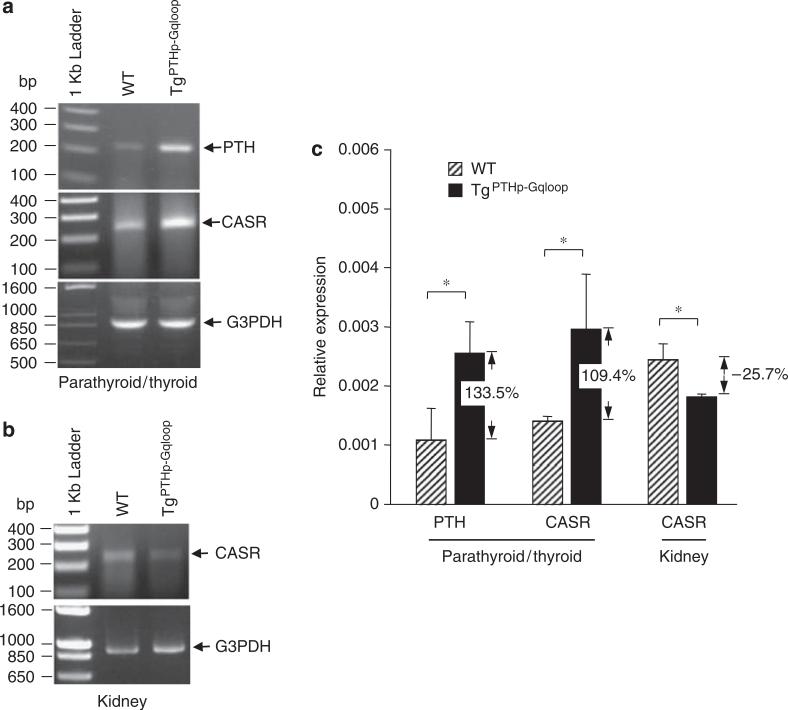
Figure 6. Comparison of PTH and CASR expression from parathyroid and kidney in wild-type (WT) and TgPTHp–Gqloop transgenic mice.
(a, b) RT–PCR and (c) Quantitative real-time RT-PCR were performed as described in ‘Materials and Methods’. Data are mean±s.e.m. from more than three individual mice. *Significant difference from wild-type and TgPTHp–Gqloop transgenic mice at P<0.05.

