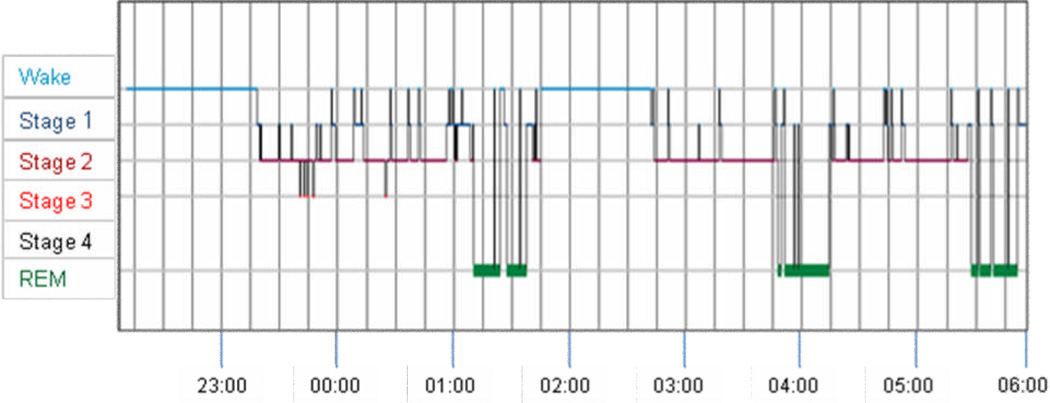
Figure 3.
Hypnogram showing clock time plotted on the x-axis versus sleep stage on the y-axis taken from standard overnight polysomnography on our patient. This figure demonstrates that compared with normative data [Lavie, 2001; Wilson and Nutt, 2008] the patient had increased sleep fragmentation and an extended period of wakefulness between 01:45 and 02:45 AM.

