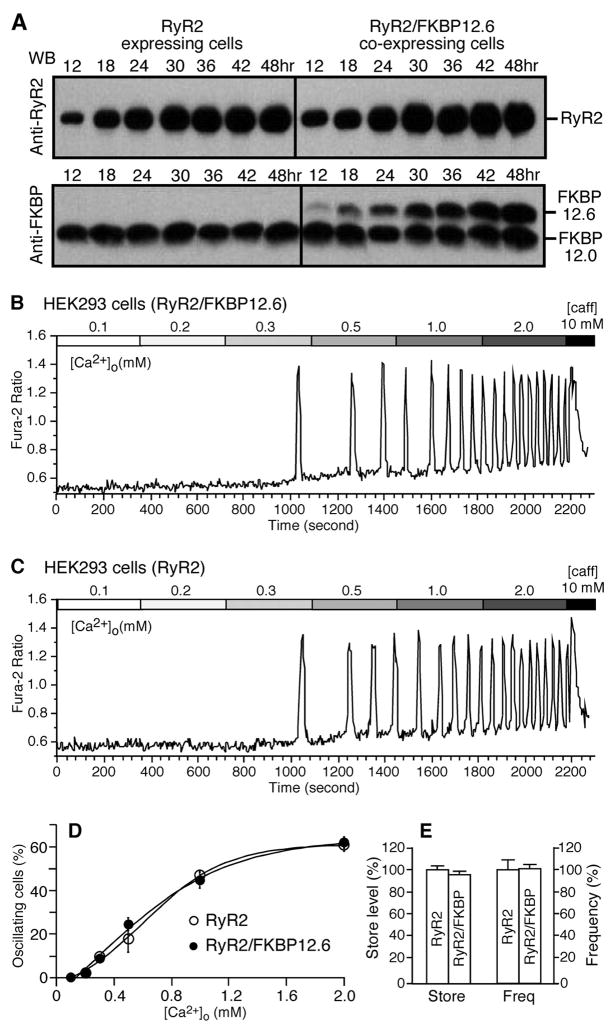
FIGURE 5. The lack of FKBP12.6 does not alter the SOICR properties.
A, HEK293 cells expressing RyR2 alone (left) or both RyR2 and FKBP12.6 (right) were induced by tetracycline for different lengths of time (12– 48 h). RyR2 and FKBP12.6 proteins from the same amount of cell lysate were immunoblotted (WB) with the anti-RyR antibody (top) or anti-FKBP12.0/12.6 antibody (bottom). Note that FKBP12.6 is in the absence in HEK293 cells expressing RyR2 alone. Fura-2 ratios of single RyR2/FKBP12.6 cells induced for 24 h (B) and of single RyR2 cells induced for 30 h (C) at elevated [Ca2+]o (0.1–2.0 mM) are shown. D, the fraction (%, mean ± S.E.) of RyR2 cells (open circles) and RyR2/FKBP12.6 cells (filled circles) that displayed Ca2+ oscillations at various [Ca2+]o. The total numbers of cells analyzed for Ca2+ oscillations were 403 for RyR2 and 508 for RyR2/FKBP12.6. E, store Ca2+ contents in HEK293 cells expressing RyR2 alone or expressing both RyR2 and FKBP12.6 were determined by measuring the amplitude of caffeine (caff, 10 mM)-induced Ca2+ release, whereas the frequency of Ca2+ oscillations was estimated from the number of peaks in the presence of 2 mM [Ca2+]o. Data shown are the mean ± S.E. from four separate experiments.

