
Figure 4.
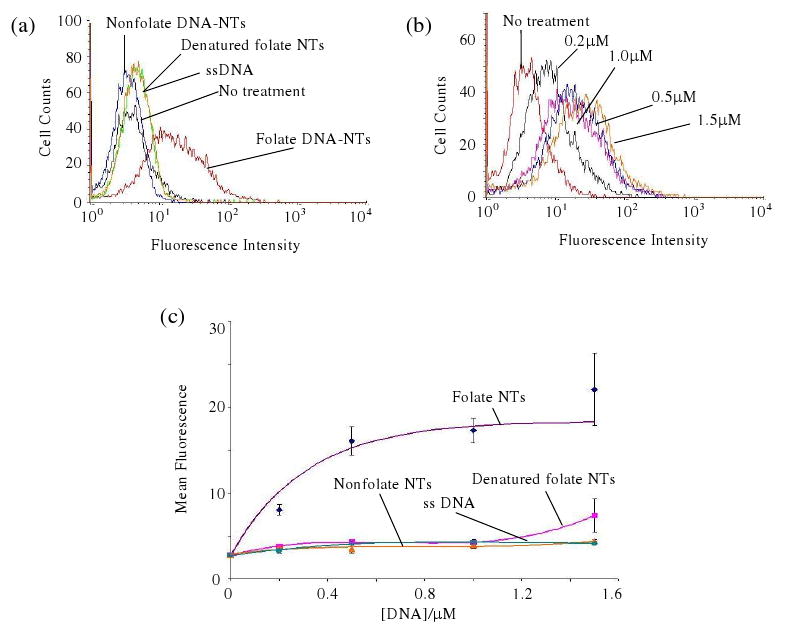
Flow cytometry analysis after 1 hour incubation. (a) Fluorescence histogram of cells incubated with different DNA samples. (b) Fluorescence histogram of cells incubated with different concentrations of DNA-NTs. (c) Mean fluorescence intensity of cells versus DNA concentrations.