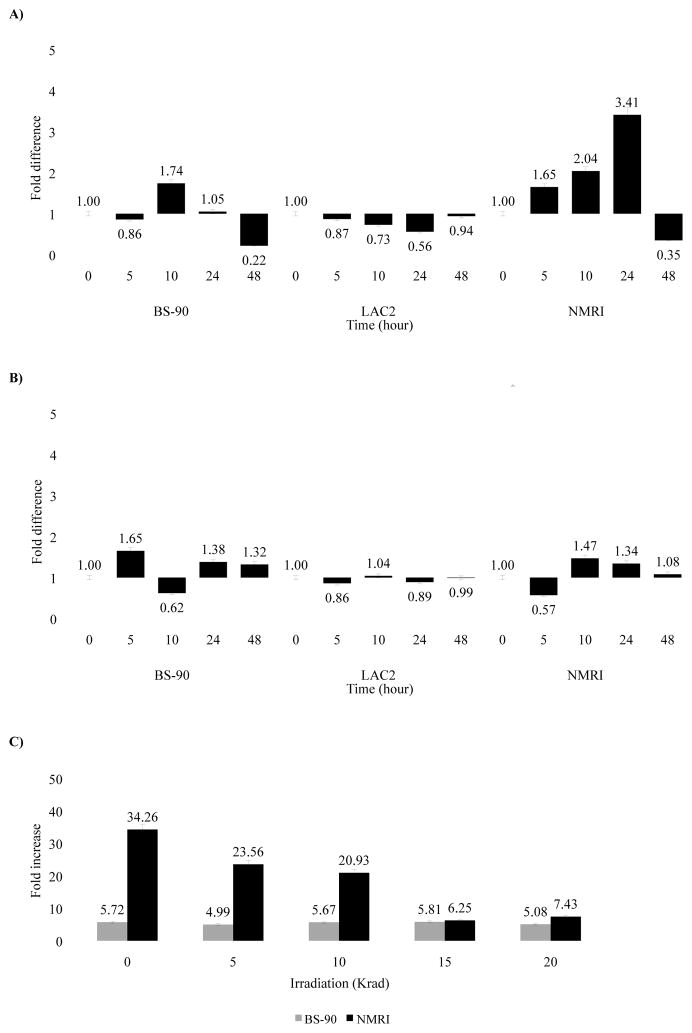
Figure 4.
Real-time Q-RT-PCR analysis of the differential gene expression of Hsp 70 in resistant (BS-90), non-susceptible (LAC2) and susceptible (NMRI) snails in either unexposed snails (0 hour) or upon exposure for various time periods (5 to 48 hours) to (A) non-irradiated miracidia, (B) 20 Krad irradiated miracidia, or (C) exposed for 5 hours to miracidia attenuated with different doses of irradiation (5, 10, 15, 20 Krad). Fold difference in gene expression was calculated by comparing expression levels of transcripts between unstressed and stressed snails by the comparative Ct method using the formula described in Materials and Methods. Significant P-values of < 0.05 is indicated by * to show the significance of gene expression determined using Student’s t-test.

