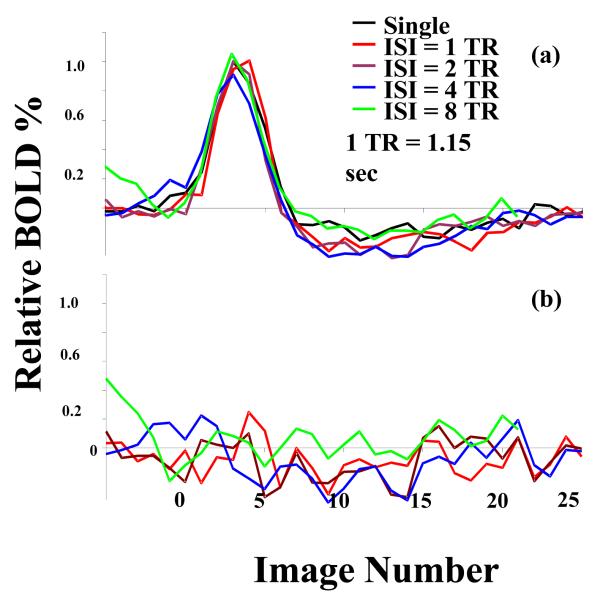
Figure 2.
(a) Time courses of the SE BOLD responses to the single stimulus and the second stimuli at all ISIs. The BOLD response to the second of paired stimuli was individuated by subtracting the BOLD response to the single stimulus from that to paired stimuli at each ISI. To align the onset of the second stimulus, the time course obtained after subtraction was shifted by the corresponding ISI. (b) The residue after subtracting the single BOLD response from the second BOLD responses at all ISIs.

