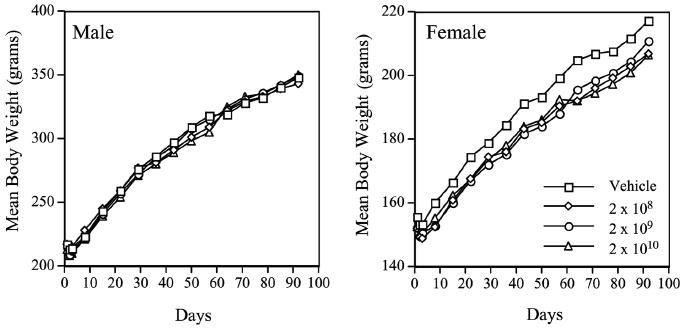
Fig. 10.

Animal body weights during AdhAQP1 toxicology study. Left panel: Mean body weight in grams is depicted for all four groups of male rats over the time course of this study. Right panel: Mean body weight in grams is depicted for all four groups of female rats over the time course of this study. The animal study groups are as indicated (doses in vector genomes of AdhAQP1). This figure was published originally as Fig. 1 in (Zheng et al. 2006)
