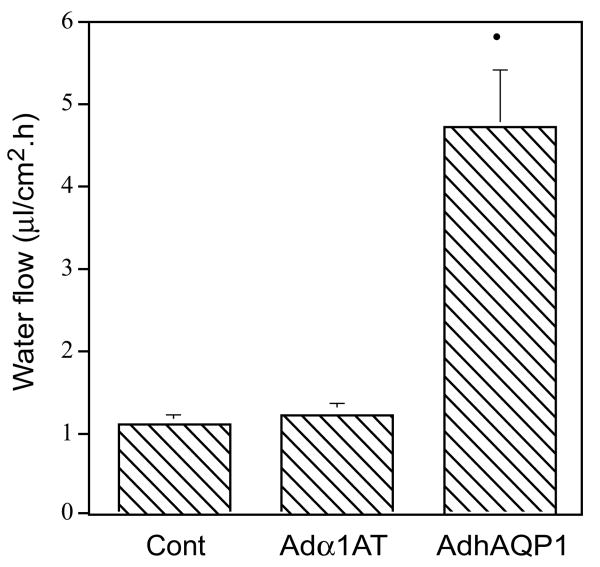
Fig. 4.
Net fluid secretion rate of MDCK cells with and without transduction by AdhAQP1. Cells were either untreated (control, Cont), or transduced with either AdhAQP1 or a control vector, Adα1AT, and water flow measured in response to an apical (400 mosm) >basal (300 mosm) osmotic gradient. The results are expressed as water flow in microliters of fluid per cm2 per hour and are mean values ± SEMs. This figure originally was published as Fig. 3 in (Delporte et al. 1997)

