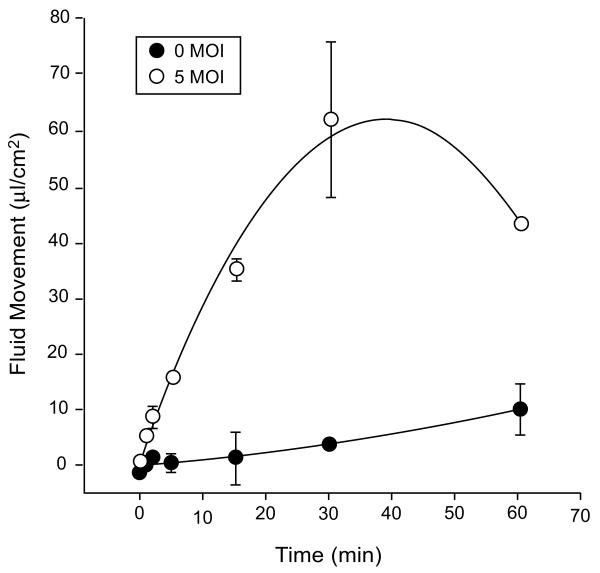
Fig. 5.
Time course of fluid movement across SMIE cell monolayers. SMIE cells were transduced with AdhAQP1 (MOI = 5) or not, and after 24 h fluid movement was measured in response to an osmotic gradient as shown in Fig. 4. The results are expressed as water flow in microliters of fluid per cm2 per hour and are mean values ± SEMs. This figure originally was published as Fig. 2 in (Delporte et al. 1998)

