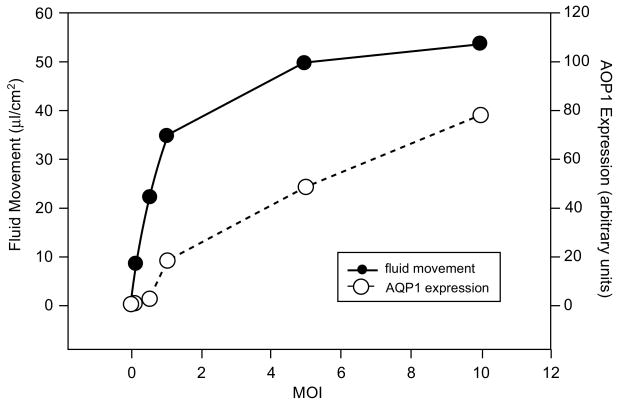
Fig. 6.
Effect of vector concentration on fluid flow across SMIE cells. After reaching confluence, SMIE cell monolayers were transduced at the indicated MOI and fluid movement then measured for 15 min. Thereafter, crude membranes from each cell monolayer were prepared, electrophoresed and subjected to Western blotting with antibody to hAQP1. The films were scanned with a laser densitometer to quantify the amount of hAQP1 expressed (indicated in arbitrary units). This figure originally was published as Fig. 4 in (Delporte et al. 1998)

