Figure 4.

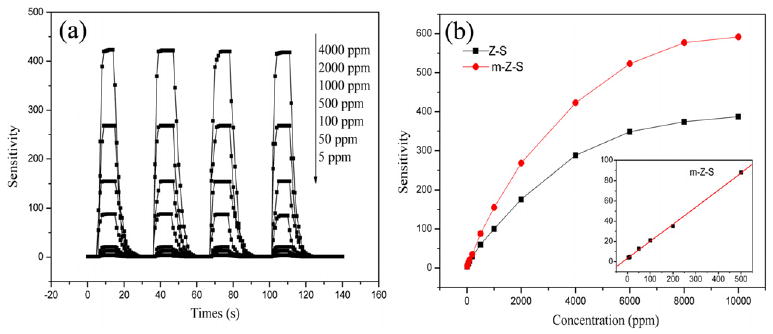
(a) Four cycles of response–recovery characteristics of m-Z–S nanofibers exposed to different ethanol concentrations, and (b) sensitivity versus ethanol concentration in the range 5–10 000 ppm.

(a) Four cycles of response–recovery characteristics of m-Z–S nanofibers exposed to different ethanol concentrations, and (b) sensitivity versus ethanol concentration in the range 5–10 000 ppm.