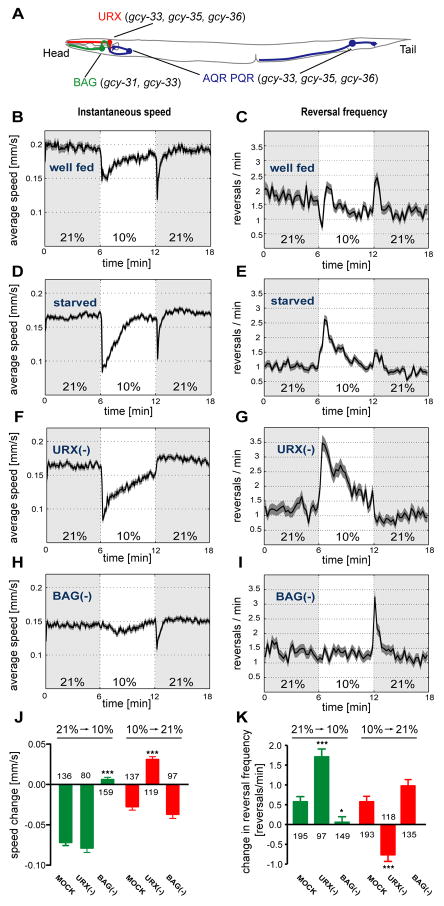
Figure 1. The URX and BAG neurons are required for responses to O2 upshifts and downshifts.
(A) A subset of sGC-expressing sensory neurons of C. elegans. Additional sGC-expressing neurons (some of ALN, BDU, SDQ, PLN) and non-sGC expressing sensory neurons (ASH, ADL, ADF) can also affect O2 responses (Chang et al., 2006; Rogers et al., 2006). (B–I) Locomotion speed and reversal rates of C. elegans off food. Traces show averages and dark shading indicates standard error of the mean (SEM). Oxygen concentrations were switched between 21% and 10%; light shading marks intervals at 21%. (B,D,F,H) Locomotion speed, calculated in 5 second bins. (C,E,G,I) Reversals per animal per minute, calculated in 15 second bins. (B–E) Wild type animals, well-fed (B,C) or 1 hour starved (D,E). For well-fed animals, average basal speed was 0.19±0.03 (SD) mm/s, range 0.14–0.28 mm/s; average reversal rate was 1.5±0.29 (SD) reversals/min, range 0.9–2.1 reversals/min (n=13 assays). For starved animals, average basal speed was 0.17±0.02 mm/s, range 0.13–0.20 mm/s; average reversal rate was 1.1±0.21 reversals/min, range 0.7–1.5 reversals/min (n=21 assays). (F–I) animals in which either URX (F,G) or BAG (H,I) neurons were killed by laser surgery. (J,K) Average speed and reversal changes to O2 upshift and downshift; (J) Difference of the mean speeds in 10 seconds before and after the switch; (K) Difference in the number of reversals in one minute before and after the switch. Error bars indicate SEM. Asterisks indicate significance by one-way ANOVA with Dunnett's post test using mock-ablated animals as a control group (* P=0.01–0.05, *** P<0.001). The numbers of animal tracks analyzed are indicated.

